Watching
Explosive Cyclogenesis
This is the fun bit as far as I’m concerned. It’s all very well
being able to look at isobars and knowing it’s going to be very wet and
windy, but anybody can do that. When it comes to being a weather enthusiast,
there’s nothing better than watching these things developing in real-time.
As I mentioned earlier, I’m going to focus on the sort of violent depressions
which form from seemingly innocuous frontal waves, and hopefully illustrate
this with ‘borrowed’ satellite images from the internet, and my
own piccies
Lets start with the classic frontal wave, in it’s ‘tame’ state. As most of you have seen time and time again, a long, unbroken trail of a weather front can extend from the UK, across the entire Atlantic basin, marking the dividing line between cold, polar air, and the warm, tropical air at the equator.
Here’s my own example……
When there are no actual depressions in the Atlantic as such, this dividing line can be remarkably straight and uniform. The following chart is a MetOffice analysis chart, used as an example of this long, unbroken front stretching into the Atlantic. In this instance, it has been analysed purely as a south-moving cold front for the time being:
http://www.wetterzentraleforum.de/archive/2005/brack/bracka20051010.gif
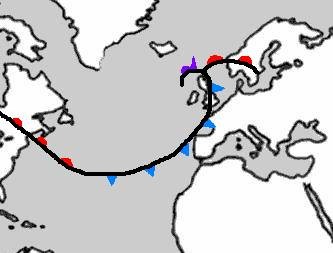
Now, this next chart is a totally different occasion, but with a similar trailing front across the Atlantic. Notice however, that this time there are indications of a wave on the front. In other words, a surge of warm air to the south of the front is beginning to move northwards, and a counteracting area of colder air is moving southwards in return. As a result, you can see a warm front symbol placed where this wave is starting to develop (in mid-Atlantic):
and here is an actual example…
http://www.wetterzentraleforum.de/archive/2001/brack/bracka20011001.gif
Ok, this is using charts again, but this is just to illustrate where to start looking for development. Now, using satellite imagery, we can see how this looks from the air, and how to spot the development once it kicks off.
Using infra-red and visible imagery.
The most obvious satellite usage are in the infra-red and visible wavelengths.
These satellites pick up either the temperatures of the clouds, or the actual
view you would have from space, respectively. It’s always very easily
to spot the trailing Atlantic front as it spans the entire Atlantic Ocean.
On this first IR satellite image, notice that there is an almost unbroken line of cloud, stretching from a large depression near the UK, through to the Mid-Atlantic (click for larger example):
(image from NOAA)
In this instance, this is a trailing cold front from the major storm over the UK, with no signs of there being any wave developing along the front (as we described looking at frontal analyses earlier).
Now, on that image, there is currently nothing to suggest that a wave is forming along this cold front, which would be the beginnings of a new depression. Normally, a wave is characterised by a chunkier bit of cloud sitting on the main front, or even a slight kink in the otherwise smooth frontal line of cloud.
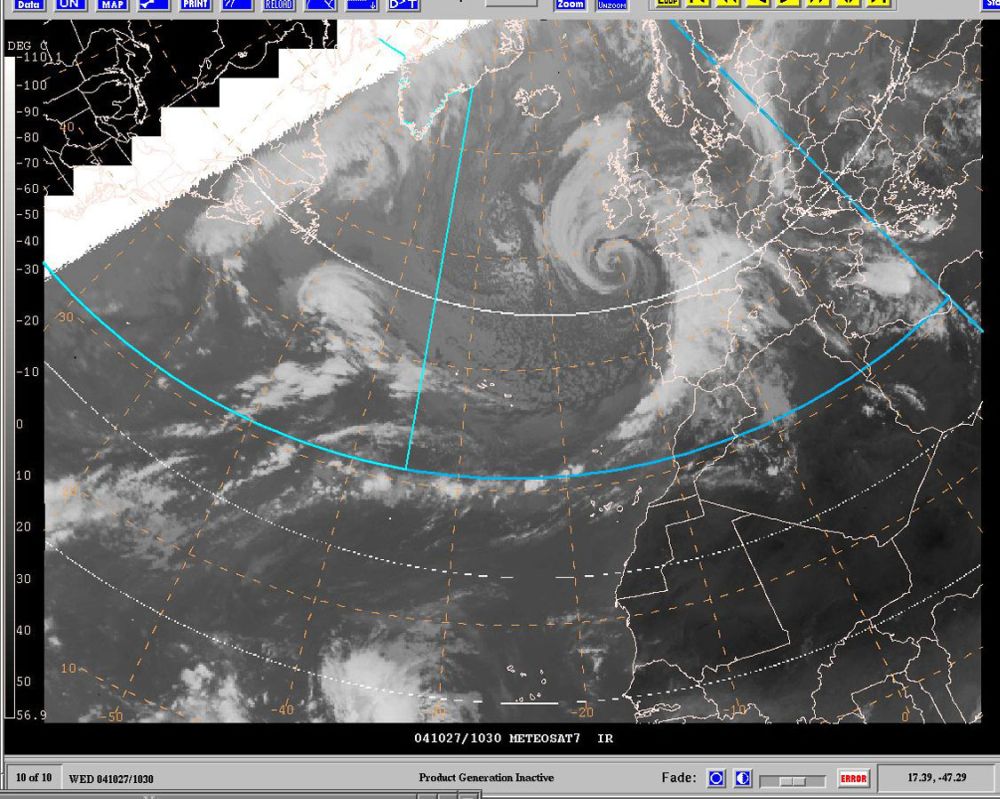
This following satellite image showers a similar Atlantic trailing front, but this time the front is developing a wave on it.
(image from http://www.zamg.ac.at)
This time, the front is angled more north-south than east-west, but it’s still part of the long dividing line across the Atlantic, as mentioned earlier. As well as the long, straight front, you’ll notice that, roughly central on the image, there is a ‘bulge” in the front (like a snake with a large egg in it’s stomach ). This bulge is actually the start of a frontal wave, as warm air starts to force it’s way north-westwards, through the main frontal band.
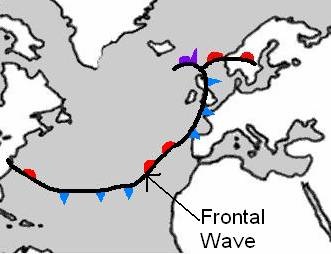
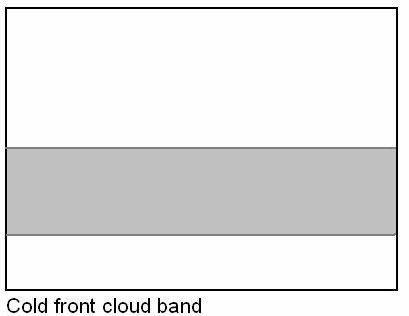
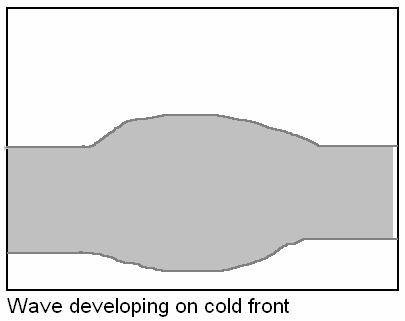
Here’s a super-basic illustration of a frontal wave. This time, the grey line is showing where the cloud will be, and it's uniform in width along the cold front. However, the blob of cloud just to the west of Spain is indicating where a frontal wave is developing:
Once you spot this wave, it is a good indication that a depression is going to form there, although at this point, that doesn’t necessarily mean it will develop rapidly, or indeed, become a monster storm.
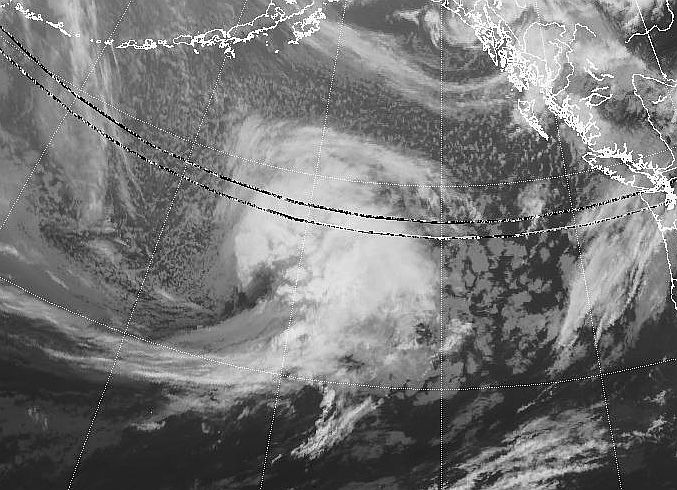
Staying with IR and VIS satellite imagery, the next thing to look out for is the formation of a baroclinic leaf, or ‘cloud-head’. In the following image, false-colouring has been used to depict cloud temperatures, rather than using simple white.
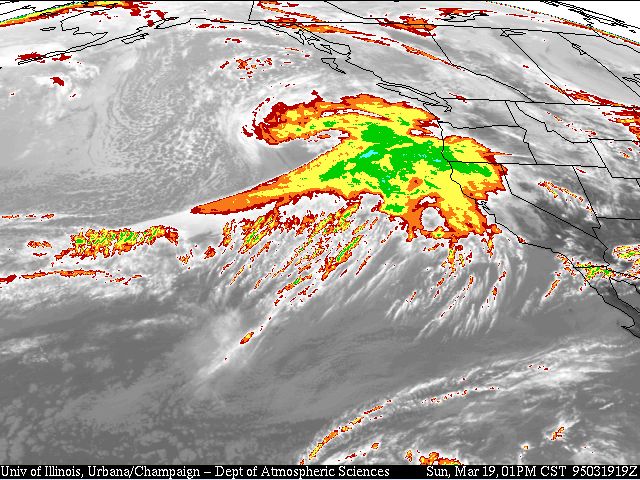
(image from tornado.sfsu.edu)
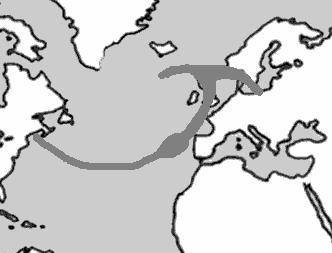
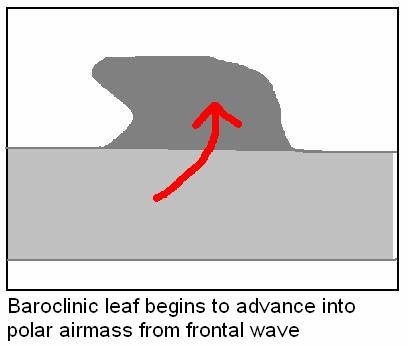
Notice the original wave formation (the large lump of colouring) that was showed on the previous image (although this time, the wave is aligned east-west once more). However, on the northern edge of the wave, there’s a huge wedge of cloud which has protruded northwards from the original wave. This is known as the baroclinic leaf, as sometimes it can resemble the shape of a tree leaf . This following diagram I’ve knocked together, shows how this leaf forms from the original wave:
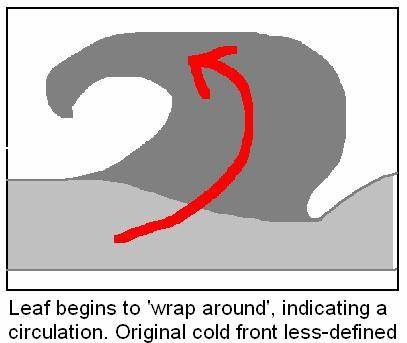
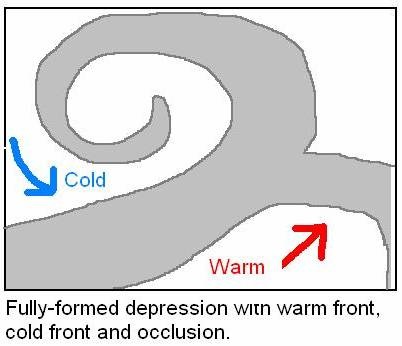
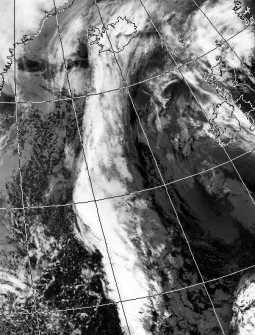
As this diagram also shows, this cloud head eventually wraps around itself, forming the characteristic swirl of an intense low pressure. Here’s a couple images of such a structure, the first image being at initial wrap-around stage, and the second being when the system is more mature:
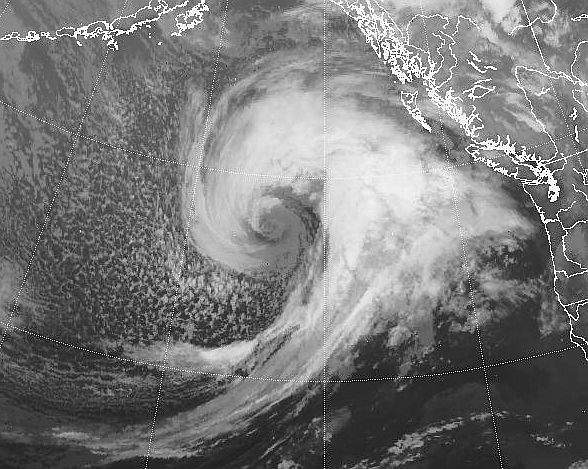
(both images from http://www.umanitoba.ca)
Baroclinic leaves form as air rapidly ascends, as it moves northwards from the original frontal zone. The leaf always extends into the polar airmass, and not the tropical airmass (in other words, always extends into the cold air, from the main frontal cloud).
So
watching the tell-tale signs of a rapidly deepening depression are quite simple
when you know what to look for. It’s worth remembering that not all examples
will be as clear cut, the orientations of these things can vary from event
to event, and complications can make the cloud structures harder to identify.