Water
Vapour Imagery (WV)
A very useful tool, when determining how ‘far-gone’ a developing low is, is the use of water vapour imagery. Certain characteristics on the images can really show you have far away a depression is from ‘bombing’. In order to explain what’s going on here, things will have to get a bit more technical (not too technical though, as you don’t need to be an expert to watch these things evolve, and find them fascinating).
Let’s start by explaining what WV imagery actually shows. Rather than directly sensing where clouds are sitting, WV sensors actually pick up moisture levels in the atmosphere, and convert it into a useable image. Obviously, the greatest amounts of moisture are where clouds have formed, so clouds are technically visible on the images. This first image below, shows a number of good characteristics (but ignore the labels on the image :
http://weather.cod.edu/notes/vap9cyc.gif
(image from http://www.weather.cod)
This is a good example, because it’s showing a nice, trailing front, like we’ve been looking at throughout this discussion. The brighter the white on this image, the greater the amount of moisture that is being sensed. The front’s position is obvious, as a line of white extending from NE to SW. In fact, on the eastern side of this, the clouds themselves are easily picked out. However, towards the western side of the front, it’s not so clear cut, and the front’s position is shown literally by the level of moisture in the air (a darker shade of grey).
The most important thing on that image, is the very black stripe just to the north of that main front. Very dark patches on WV imagery show where the air is very dry, containing very little moisture. This usually only occurs where the air is sharply descending in the atmosphere, with cold and dry air from the upper atmosphere being dragged down to the surface.
In other words, the dark stripe on that satellite image is showing you where dry, sometimes stratospheric air (being from the stratosphere or top of the troposphere) is descending rapidly down to the surface.
As an aside, one of the many ingredients which has been recognised as ‘bomb-fuel’,
is the addition of this very dry, stratospheric air. A rapidly deepening depression
will really take off, once this drier air is ingested into the developing
baroclinic leaf. Indeed, without the existence of very dry air aloft at the
time of the storm’s development, the depression may never get going at
all. There are many complex reasons for why this dry air interacts and creates
such massive development, but I won’t go into that here, as it’s
not important for the monitoring and watching of such systems.
Here’s another image of a very dry stripe of air, riding just along the northern edge of the trailing front (this time in the east Pacific, and again shown by the dark black area).
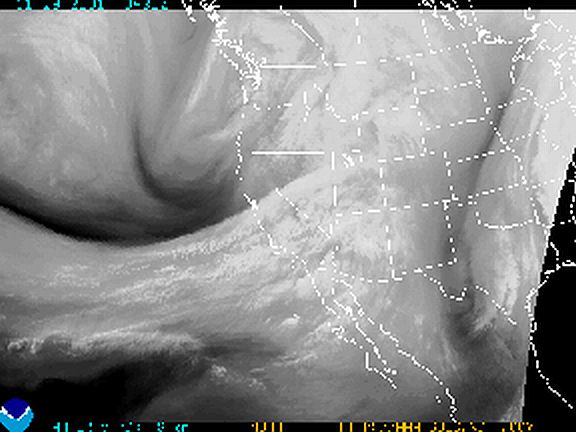
(images from http://www.weatherworks.com)
This dry area is known as the ‘dry-slot’, and again marks the area of rapidly descending upper-level air. Now, on the above image, the trailing front has no wave formation on it, as it’s pretty much of uniform width along its entire length. However, the next image shows a nice baroclinic leaf which has moved northwards from the main front. This is also a WV image, and if you look closely, you can see some very dry air (black on image) just to the western side of the main baroclinic leaf:
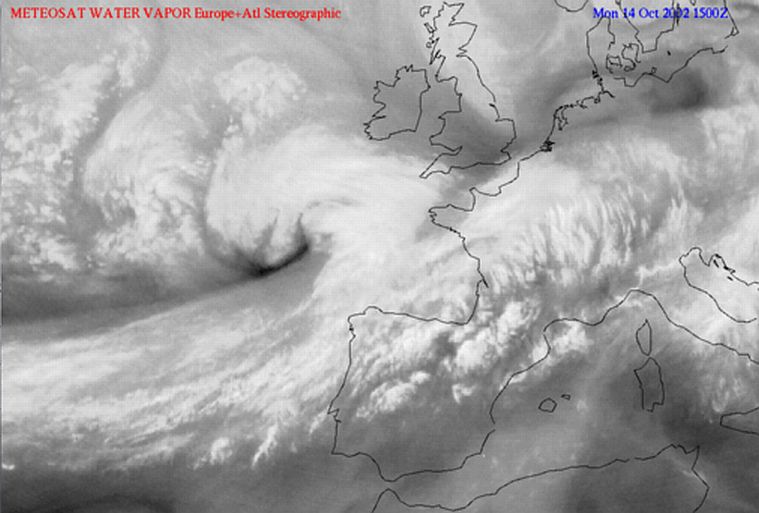
(image from http://www.zamg.ac.at)
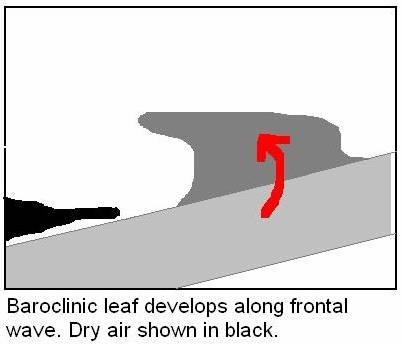
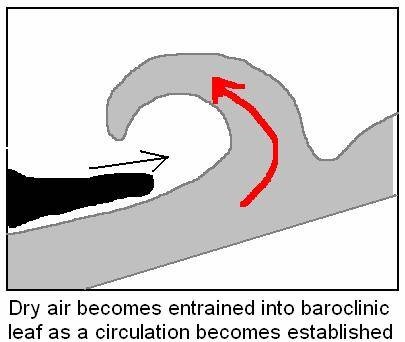
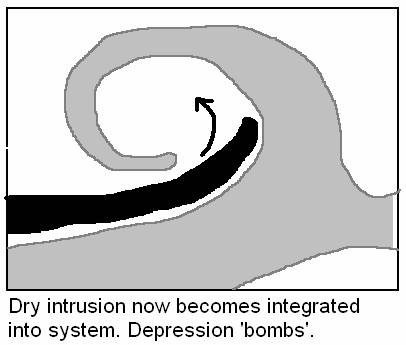
In fact, this baroclinic leaf is already well-developed, and is starting to wrap around in a cyclonic manner. This very dry slot of air now becomes ingested into the cloud head, effectively sucked eastwards into the base of the baroclinic leaf. Imagine the dry slot travelling eastwards towards the base of the leaf, along the northern edge of the main trailing front. This very dry air is now termed a ‘dry-intrusion’. This diagram below shows how the dry intrusion interacts with the developing cloud-head, and how it is entrained into the system:
So that just about wraps up the basic things to look for when using the three
main variations of satellite imagery. Using visible and infra-red imagery,
it’s important to look out for:
•
Wave forming in trailing front
• Baroclinic leaf (cloud head) sprouting from the trailing front
• A cyclonic ‘wrapping up’ of the baroclinic leaf
… and using the water vapour imagery, it’s important to look out for:
•
The existence of dry air close to where a frontal wave is developing
• A dry-slot on the polar side of the trailing front
• A dry-intrusion being ingested into the base of the baroclinic leaf.
With these things starting to appear, you can bet your life that within 24-48hours, you’ll have a whacking great depression on your hands.
Finally, this series of images from western Canada shows the lifetime of explosive cyclogenesis, from frontal wave, through baroclinic leaf, to fully-blown depression. Images are all taken from www.umanitoba.ca:
Wave forms on trailing front. The trailing front is tricky to pick out…
http://www.umanitoba.ca/faculties/environment/envirogeog/weather/images/bleaf/leaf1.jpg
The baroclinic leaf is now well formed, and beginning to wrap around on itself…
http://www.umanitoba.ca/faculties/environment/envirogeog/weather/images/bleaf/leaf10.jpg
Now, a fully formed spinning low has developed. The system has bombed…
http://www.umanitoba.ca/faculties/environment/envirogeog/weather/images/bleaf/leaf25.jpg
So why are these things so dangerous, and what about them causes such havoc? This seems obvious to answer – tonnes of rain and strong winds. However, it’s not quite as simple as that, as there are many things unique to bombing depressions, that don’t usually occur during less intense storms. Some of these are listed below.
The Sting Jet
In recent years, this phenomenon has come under scrutiny, and is now accepted as a process responsible for the strongest surface winds experienced. As the very dry air descends rapidly from upper levels in the developing storm, it doesn’t just bring the air down with it. Simplistically, it also drags the frontal jet down with it too. In effect, part of the jet-stream is actually deflected down to the surface – no wonder it’s windy !
When looking at the satellite imagery, imagine where the first part of the baroclinic leaf starts to wrap around itself. This can resemble a hook shape, or as is often said, it looks like a scorpion’s tail that is being wrapped up. On the forward-nose of this hook, as it turns back eastwards, is the area where sting-jets can occur. As the dry upper-air descends through the cloud head, it cools evaporatively, and becomes more dense than its surroundings. As a result, it descends quicker and quicker until it smashes down to the surface. As this hits the surface, exceptionally strong gusts of wind are reported. Remember, these are gusts of wind which are already occurring on top of the already very strong winds. For instance, in North Wales in the Christmas storm of 1997, sting jets created gusts in excess of 100mph, creating much damage.
It’s worth remembering too, that in many deep depressions we see in the UK, the strongest winds are usually (but not always) on the southern flank of the low. Sting-jets just make these winds even stronger!
Shallow-moist zone
Many low pressure systems exhibit this, but it’s a phenomenon which can be altogether more impressive within deep, explosive depressions. Once the depression is fully formed, with a classic cold front, warm front and occlusion, a shallow-moist zone can develop.
Cold fronts are often formed between a surface cold front, and an upper cold front. In the case of strong depressions, as polar maritime air swings in from the north-west, behind the cold front, it can really go at some pace. It effectively gets a sling-shot around the deep area of low pressure, and is very fast moving on the low’s southern flank.
Now, air moving at upper levels is faster than the air at the surface. As a result, the upper cold front can blast far ahead of the surface cold front, technically leaving it straggling behind. In effect, the cold frontal boundary is ripped in half. The top half is sheared off, leaving a shallow zone of warm, moist air at the surface, ahead of the surface cold front.
On the image below, the cold blast of mid and upper level air has sheared the upper front, and pushed it well ahead of the surface cold front. The SMZ is the moist, shallow layer of air at the surface, between the two fronts.
Now, when you have a layer of very warm and humid air, beneath a slab of cold and dry air, you have a lot of instability. The warm air wants to rise above the cold air, in the form of convection. Sometimes, in the shallow-moist zone, as most of the frontal cloud has been ripped away to the east, the sun can come out. If it does, it can give added energy at the surface, and this increases the instability. It’s a form of ‘loaded gun’ scenario, but a direct result of the cold frontal boundary being ripped in two.
Eventually, if the capping layer of colder air breaks, all the energy building up in this shallow zone of moist air at the surface can explode upwards. As a result, large thunderstorms can break out, all containing their own strong winds and heavy rain. These can then align along the surface cold front, forming an impressive squall line.
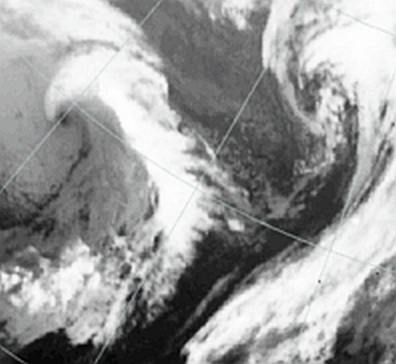
The shallow moist zone is best seen on IR satellite images, because the upper cold front appears bright (very cold) whilst the surface cold front appears rather dull (warmer). This satellite image below shows a developing low (the comma cloud) and also a shallow moist zone. I’ve annotated the diagram to show the relevant bits
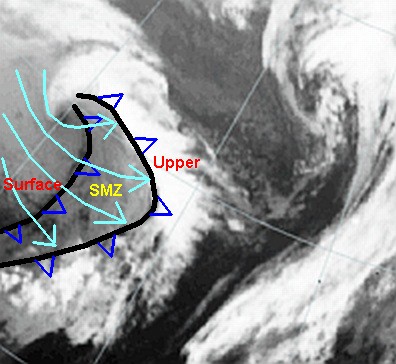
On the above image, the cold blast of mid and upper level air has sheared the upper front, and pushed it well ahead of the surface cold front. The SMZ is the moist, shallow layer of air at the surface, between the two fronts.
Right, this has been a basic overview for what to look out for when explosively
deepening depressions are expected to develop. These things happen at great
pace, sometimes in as little as a day, and they’re a real headache for
forecasters. One thing is for sure, we’ll see one of these at least once
a winter, so hopefully, if any of you weren’t sure what to look for before,
this may help
Please please please, if anyone has any questions, comments, or wish to correct any inaccuracies you think I may have made, please don't hesitate to contact me.
Please remember as well, that this is a simple report, and is not intended to be scientifically exact, in order to maintain simplicity.
Bren J.
Internet references:
http://www.wetterzentrale.de
http://www.noaa.gov
http://www.zamg.ac.at
http://www.tornado.sfsu.edu
http://www.umanitoba.ca
http://www.weather.com
http://www.weatherworks.com
http://www.umanitoba.ca
|
End |