The
Chase - continued
Click all photographs for larger copies
All radar images are used with permission from PA Weathercentre.
With the developing cell now in our vicinity, each of the following radar slides are displayed at a larger scale to take account of its detail. The radar slides are interlinked with images that were taken at the time. The red flag marks the position of Burford, which lay just north of our final observation point. Other marker points are included to denote locations from where certain photographs were taken.
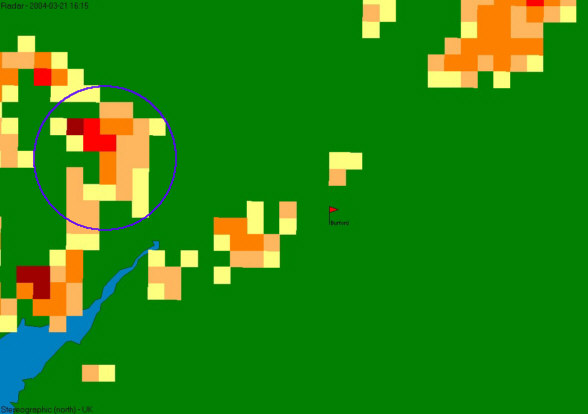
1615
GMT - This slide is a larger-scale version of that on Page 2, zoomed in for
clarity. Note the area of maximum intensity precipitation (>10mm/hr) towards
the NW of the cell, with progressively lighter precipitation falling upwind
to the east.
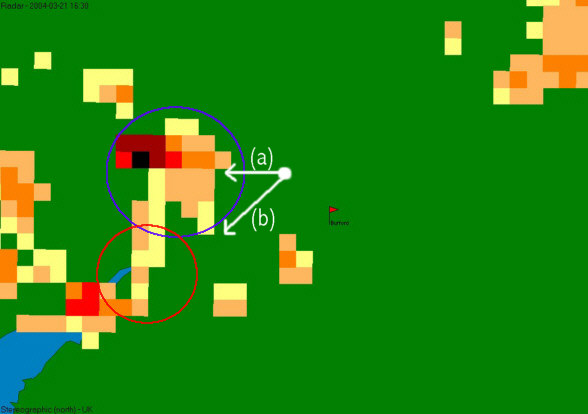
1630
GMT - Precipitatiom intensity now reaches >30mm/hr to the NW of the cell,
with the lighter precipitation falling from the rapidly spreading anvil ahead
of the main core. The white disc represents our location at 1630 GMT, and
the arrows correspond to the direction in which the following photographs
were taken.

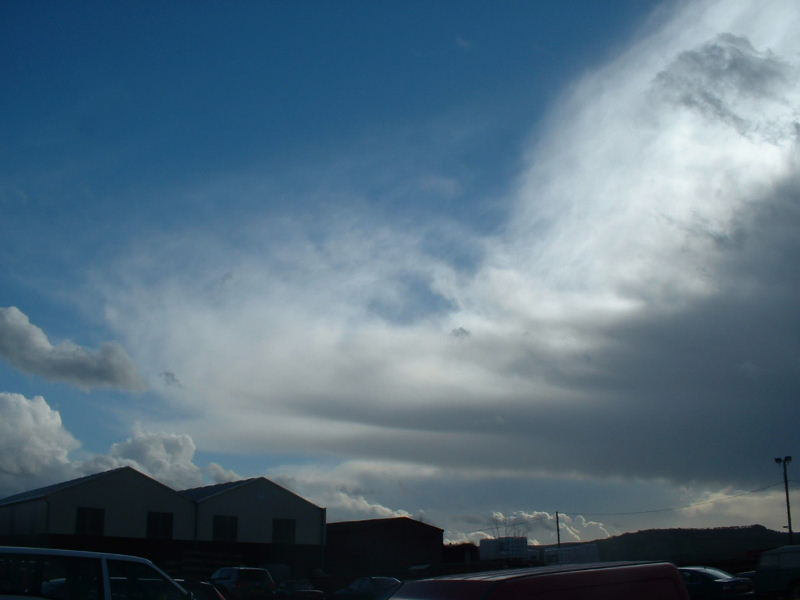
(a)
This image is taken looking directly west from our location (marked by white
disc). It encompasses only the forward edge of the streaming anvil.
(b)
This image is taken looking south-west from the same location, with the forward
edge of the cell's anvil in view. The cell in the background, behind the foreground
anvil, corresponds to the small shower circled in the 1630 GMT radar image.
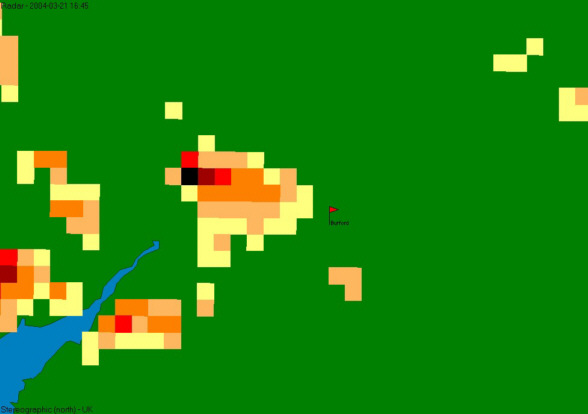
1645
GMT - The cell was now taking a very interesting form, with the main core
(>30mm/hr) remaining in the NW region of the cloud, with the rainfall ahead
of this streaming out to the east beneath an ever-spreading anvil.
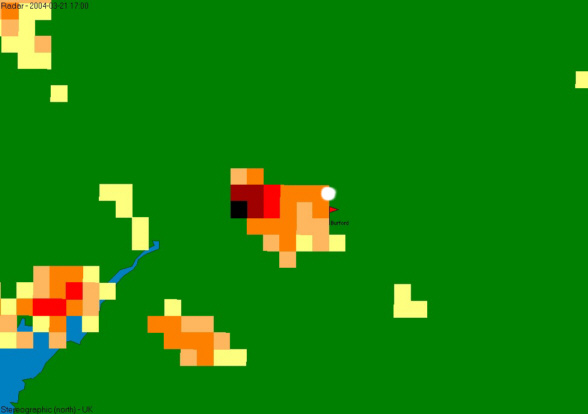
1700
GMT - The area of >30mm/hr precipitation increased in area on the rear
flank of the cell, whilst the precipitation falling from the anvil now reaches
Burford to its east. Without us knowing at the time, the central core was
now producing hail. The white disc north of Burford represents our new location
at 1700 GMT, and is shown as a green disc on the following map.
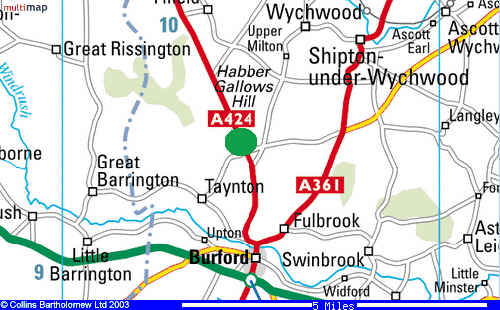
1700
GMT - We had driven south to this location, on the A424 between Burford and
Stow-on-the-Wold (see following photographs).
(Image from http://www.multimap.com)
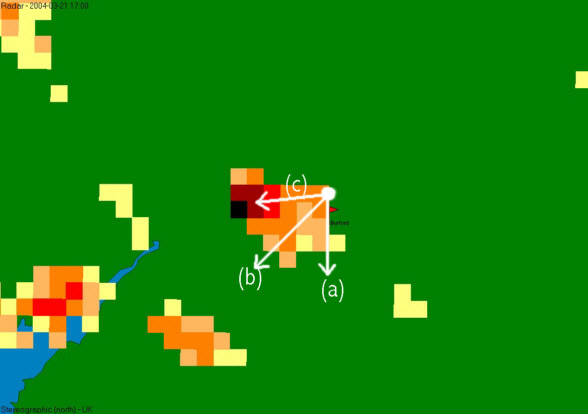
This
is the 1700 GMT radar image repeated, but showing the direction in which the
following images were taken.

(a)
This image was taken looking south from the above location. A distant Cb is
dwarfed by the huge anvil streaming above our heads, from right to left (or
west to east). At this point, moderate rain and occasional sleet were falling.

(b)
From the same location, but looking south-westwards. In this image, the low
anvil can be seen sloping from left to right downwards towards the main core.

(c)
From the same location, but looking directly west into the core of the storm.
Note the radiating anvil streaming towards us from the main storm centre.
At this point, sharp static was being heard over the AM band of the car radio,
and deep grumbles were being heard directly above us (anvil lightning?).

This
image is a close-up of where the huge spreading anvil to the east of the storm
reaches the main storm core (and seemingly the ground due to the shafts of
precipitation).